This report works through four years of primary-source NGCB data in five parts: what the monthly sub-area figures show about Durango's opening and the broader locals market since January 2022; how Red Rock Resorts' and Boyd Gaming's own reported financials track against that market data; an estimate of how gaming market share has shifted between the two companies and the rest of the field; a check of what each company's investor presentations claim against what the underlying data actually supports; and a cross-check against four Wall Street and credit analysts who have published independently on this market.
The headline findings: Durango's opening coincided with genuine, measurable growth in Balance of County trading volume — not just gaming win — but RRR's own gaming revenue also grew faster than its market in three of the last four years, meaning expansion and share capture both happened, not one instead of the other. Boyd's estimated share of the three-area market fell by roughly four percentage points over the period, concentrated specifically where RRR expanded. And the widely repeated claim that the locals market is outperforming the Las Vegas Strip holds up under scrutiny — the Strip's already-flat 2025 result turns negative once a volatile baccarat swing is stripped out, while the locals market grew through the same period. The sections below walk through the data and sourcing behind each of these conclusions.
The Data: Clark County Sub-Area Gaming Revenue, January 2022 – April 2026
The Nevada Gaming Control Board publishes detailed monthly gaming revenue reports broken out by geographic sub-area within Clark County. The three areas most relevant to the Las Vegas locals market — and to Red Rock Resorts' footprint — are North Las Vegas, the Boulder Strip / Boulder City corridor, and the Balance of County area, which encompasses the western and southwestern submarkets where Red Rock's core properties sit.
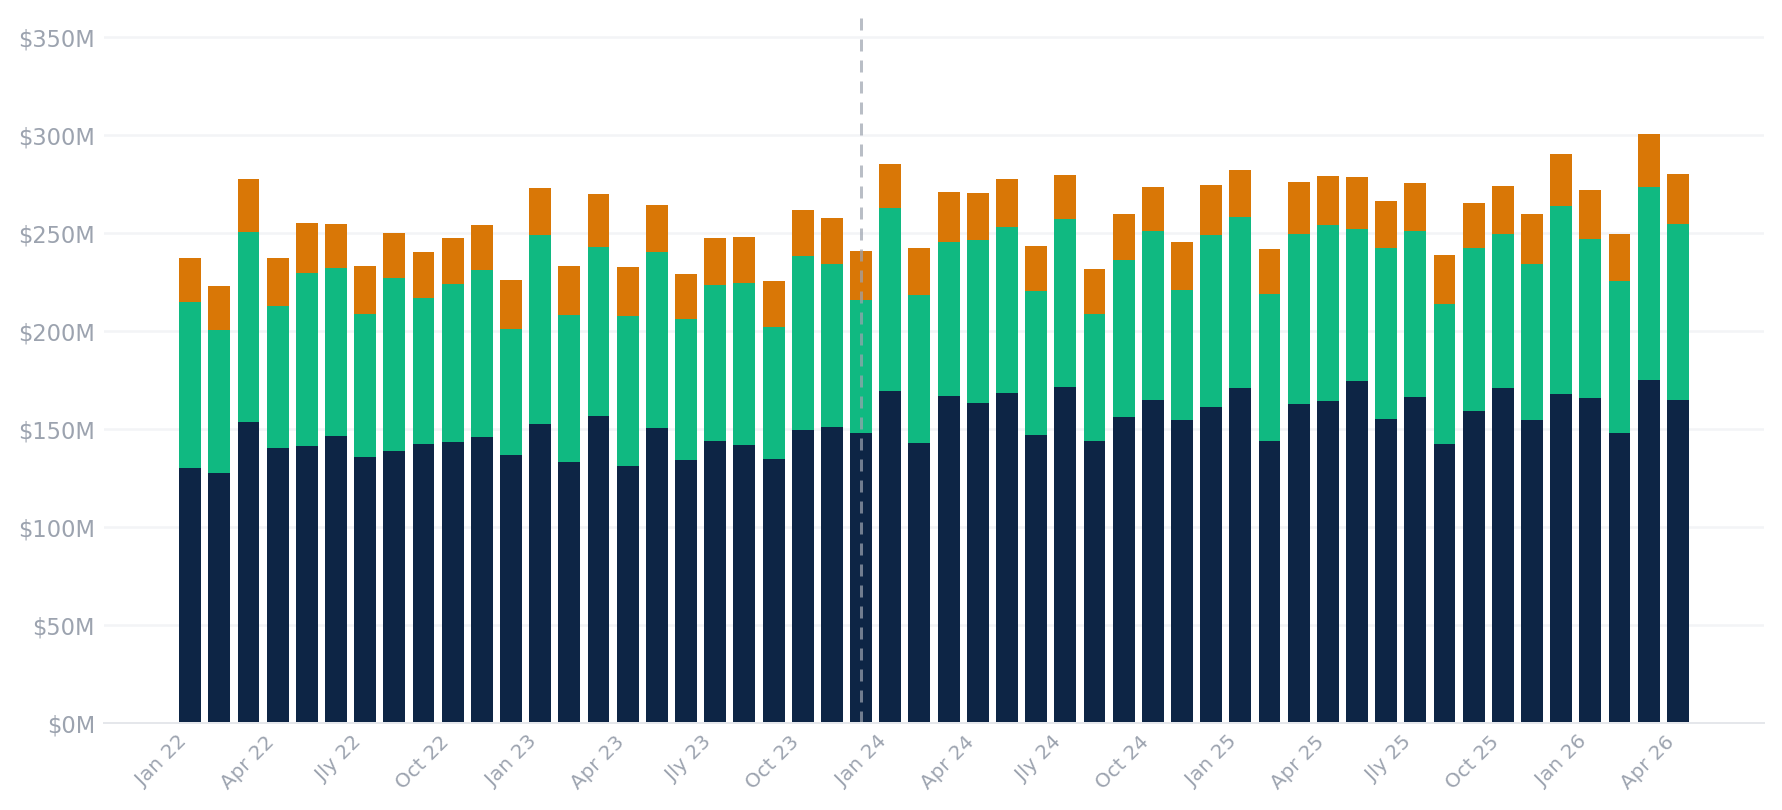
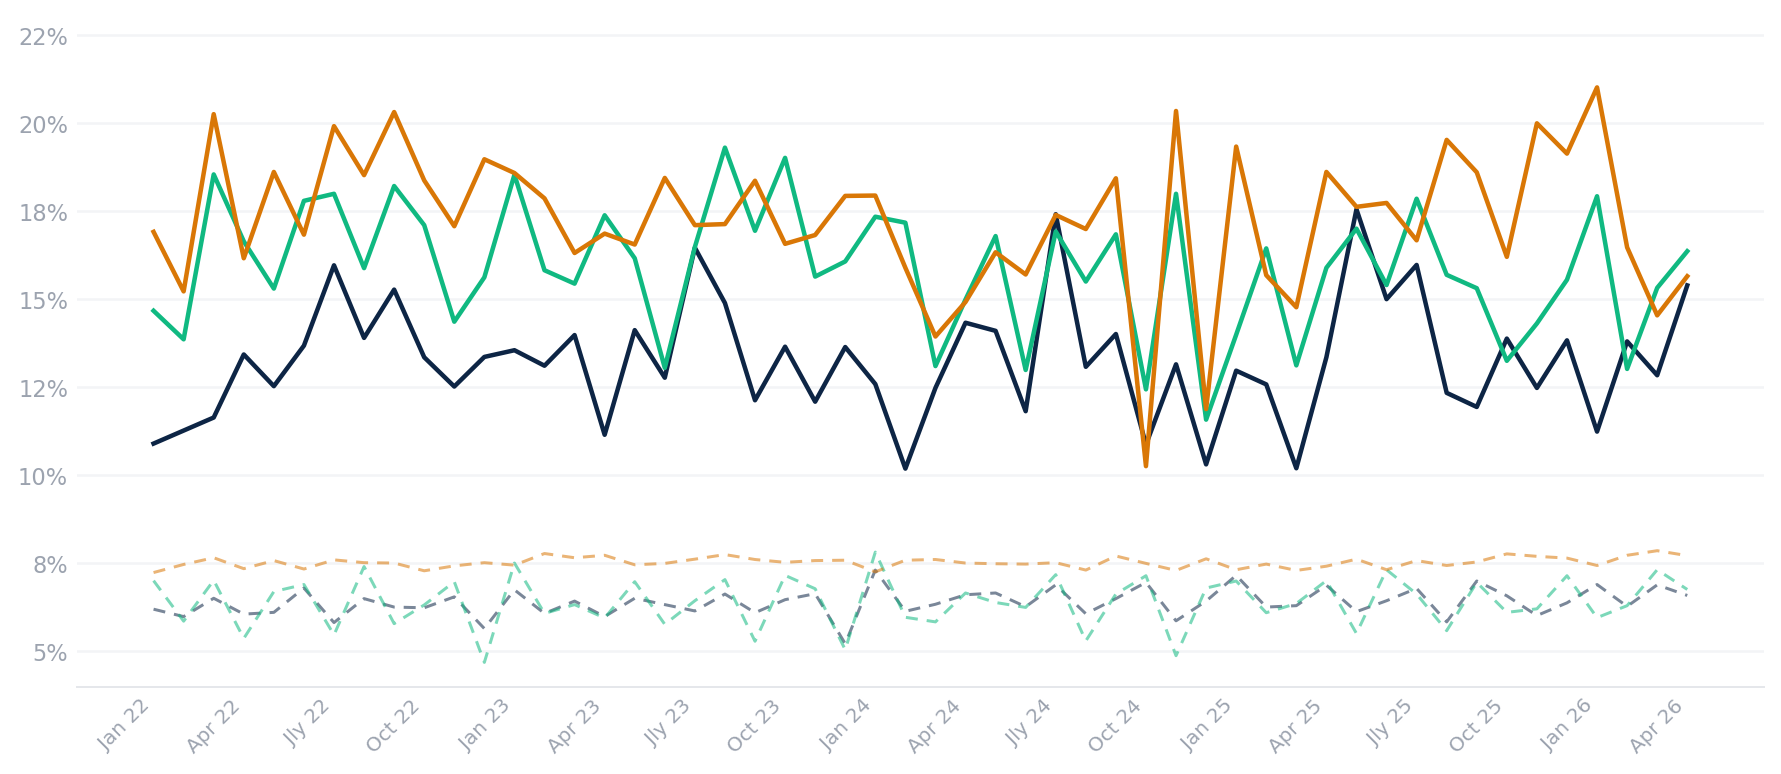
The chart below presents total gaming revenue win (table games plus slots) across all three sub-areas on a monthly basis from January 2022 through April 2026 — 52 months of primary data. A full two years of pre-Durango monthly data is included deliberately: without a genuine pre-opening baseline, it is impossible to test whether Durango expanded the local gaming market or simply rearranged demand within it. Total monthly win across these three sub-areas has ranged from approximately $223 million to $300 million over the period, and the Balance of County area alone has accounted for roughly 55–63% of the combined total in every single month, reflecting its density of large-format locals casino resort properties.
What the Data Shows: Three Major Market Observations
1. The Balance of County area is the market — and it is consistent
The Balance of County sub-area — which encompasses the western Las Vegas Valley, Green Valley, Summerlin, and the southwestern corridor — accounts for roughly 55–63% of combined three-area gaming revenue in every month in the dataset. This is the geographic heart of the Las Vegas locals market and the concentration zone for Red Rock Resorts' highest-performing properties: Red Rock Casino Resort, Green Valley Ranch, and the newly opened Durango Resort.
What strikes me about the Balance of County data is its stability. Monthly gaming win in that sub-area has ranged from approximately $127 million to $175 million across the 52-month period — a band of roughly 37% peak-to-trough, and notably tighter once you exclude the early-2022 stretch still working through post-pandemic normalization. For a sub-area that includes multiple large-format resorts, that is a well-behaved revenue profile. It reflects a locally-driven demand base (Las Vegas residents, not tourists) that is less exposed to air-travel disruption, convention calendars, and macro leisure spending cycles than the Strip.
2. Seasonality is real and predictable — and matters for modeling
All four years in the dataset show a consistent seasonal pattern: gaming revenue dips in late summer (August is reliably one of the softer months in all three sub-areas), builds through the fall, peaks around December/January, weakens in February, and recovers into spring. March is consistently a standout month across the entire 2022–2026 history — March 2026 was the highest month in the dataset at $300 million combined, but March 2022, March 2023, and March 2024 each rank among the strongest months of their respective years as well.
This seasonality is more pronounced in the Boulder Area and North Las Vegas sub-areas than in the Balance of County, likely reflecting a mix of smaller-format properties more exposed to month-to-month consumer spend variability. For anyone modeling these operators, running projections on a monthly rather than quarterly cadence is worth the added granularity — with four full years now in hand, the seasonality pattern is consistent enough to anchor forecast assumptions with real confidence.
3. The longer baseline changes the Durango conclusion
This is where the investor lens matters most. The January 2022 dataset start was chosen specifically to provide a genuine pre-opening baseline — without it, any conclusion about Durango's market impact is just pattern-matching against the post-opening period. Durango opened December 5, 2023. Red Rock Resorts positioned it as a transformative addition — an 83,000-square-foot casino embedded in a 533,000-square-foot resort facility in the rapidly growing southwestern Las Vegas Valley, targeting an affluent local demographic in a submarket previously underserved by large-format gaming.
The Durango Effect, Revisited: Expansion, Not Just Reshuffling
With a genuine pre-opening baseline now available, the picture looks different than it did with only a post-opening window of data.
Balance of County gaming win averaged approximately $141.7 million per month in the 23 months before Durango opened (January 2022 through November 2023) and approximately $160.0 million per month in the 29 months since (December 2023 through April 2026) — an increase of roughly 12.9%. On a calendar-year basis, Balance of County win grew from $1.68 billion in 2022 to $1.93 billion in 2025, a cumulative increase of about 15%. Having a genuine pre-opening baseline on both sides of the Durango opening is what makes this comparison meaningful. Boyd Gaming's public financials add a critical dimension: Boyd's Las Vegas Locals revenue fell 3.6% in 2024 while the BalCo aggregate gaming win grew 10.5% — confirming that a meaningful portion of Durango's apparent market contribution came from displacing a specific competitor's revenue within the same sub-area, not purely from generating net-new demand. Both effects are real: the aggregate market genuinely grew, and RRR also captured material share from Boyd. The volume metrics examined later in this report further support the expansion thesis, but the Boyd data makes clear that aggregate sub-area growth masked significant within-BalCo redistribution.
It still does not prove Durango is purely additive — some of that lift reflects broader market growth, inflation in average spend, and normal recovery dynamics unrelated to any single property — but it no longer supports a pure cannibalization read either. The volume and hold-rate data examined later in this report strengthen the case: table hold rates were essentially unchanged (13.20% pre-Durango vs. 13.11% post), and slot hold rates moved only modestly (6.29% to 6.47%). Stable hold rates confirm that the win growth reflects genuine increases in wagering volume rather than a structural shift in how much the house retains per dollar wagered.
The Boulder Area and North Las Vegas sub-areas, by contrast, grew far more modestly over the same stretch — Boulder Area calendar-year win was up only about 3.1% from 2022 to 2025, and North Las Vegas about 3.5%. That divergence is itself informative: the sub-area where Durango actually operates outgrew the other two by a wide margin, which is more consistent with a property that is drawing some genuinely incremental demand into the Balance of County corridor than with one that is simply redistributing a fixed pool of local gaming spend across Clark County.
My read — updated from where I landed previously, and consistent with what I see in the broader RRR financial model — is that Durango is performing well on its own terms and is contributing real, if not dramatic, growth to the sub-area rather than being funded entirely by softness at RRR's legacy properties. That said, the Station Casinos legacy (Red Rock is a successor to Station) built its competitive moat through geographic capture of local residents, and some degree of internal cannibalization within the RRR system is almost certainly still occurring beneath the sub-area aggregate — NGCB data is reported by geography, not by operator or property, so a property-level read still requires RRR's own disclosures. The sub-area-level growth is real; how it nets out property-by-property within RRR's portfolio is the next question worth modeling.
The Boulder Area: A Separate Competitive Dynamic
The Boulder Strip corridor tells a different story. Boulder Area gaming revenue is more volatile month-to-month and has shown the widest range of the three sub-areas — from a trough near $64 million (December 2022 and August 2024) to a peak near $99 million in March 2026. This sub-area is home to properties including Sunset Station and Boulder Station (both RRR), as well as competing operators. The wider variance likely reflects a consumer base more sensitive to economic conditions and a property mix more exposed to promotional spend cycles.
Over the full four-year window, Boulder Area growth has been the most muted of the three sub-areas on a calendar-year basis (roughly 3.1% from 2022 to 2025), even though it shows some of the strongest short-term year-over-year swings in the dataset — particularly the early-2026 months versus the same period in 2025. Whether the recent strength reflects improving consumer conditions, promotional strategy shifts by RRR or competitors, or simply noise in a smaller revenue base is worth tracking closely in the months ahead.
North Las Vegas: Stable, Smaller, Structurally Different
North Las Vegas gaming revenue runs materially lower than the other two sub-areas — in the $22–27 million monthly range across the full four-year dataset — and is structurally different: this is a market served primarily by smaller-format locals casinos and tribal properties, without the large resort-format operators that dominate the other two corridors. Revenue here is remarkably stable (the lowest-volatility of the three sub-areas), growing roughly 3.5% on a calendar-year basis from 2022 to 2025 — modestly ahead of Boulder Area but still well behind the Balance of County's growth rate — which is consistent with a locally captive consumer base and a limited competitive dynamic.
Going Deeper: Table Drop, Slot Handle, Win%, and Total Gaming Volume
Gaming win — the headline number in the NGCB reports — is the end result, but it is not the only signal worth reading. The underlying volume metrics tell a more granular story: table drop (the total chips purchased, which converts to win at the table hold rate), slot handle (total coin-in through the machines), and win-as-a-percentage of volume each carry distinct information about demand intensity, game-mix shifts, and operator efficiency. When you examine those metrics alongside win, a clearer picture of what Durango actually did to the Balance of County market emerges.
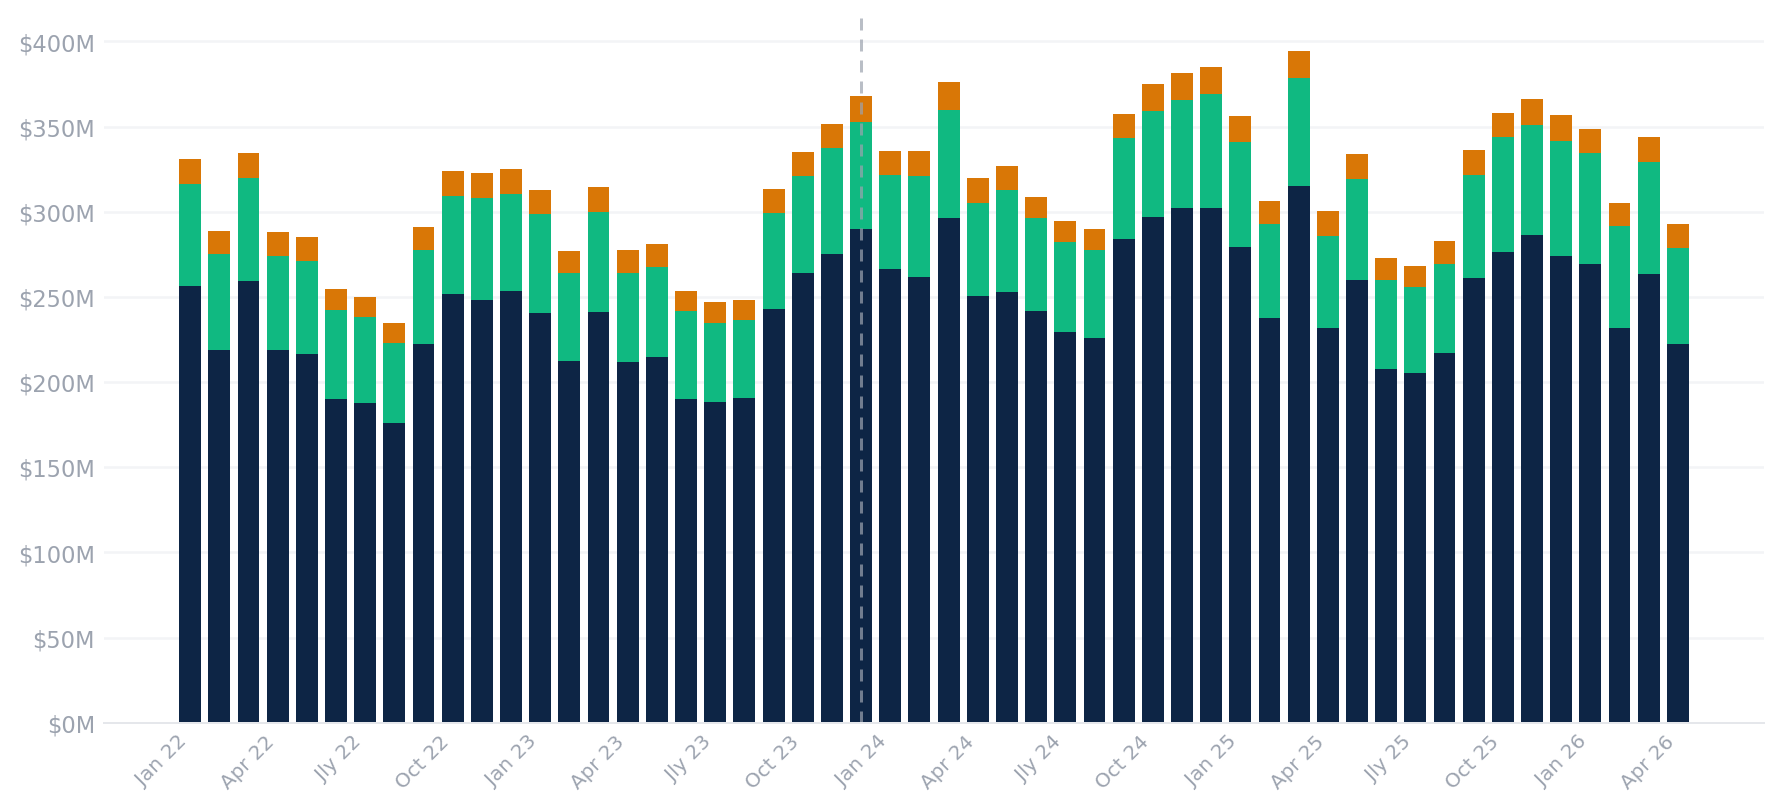
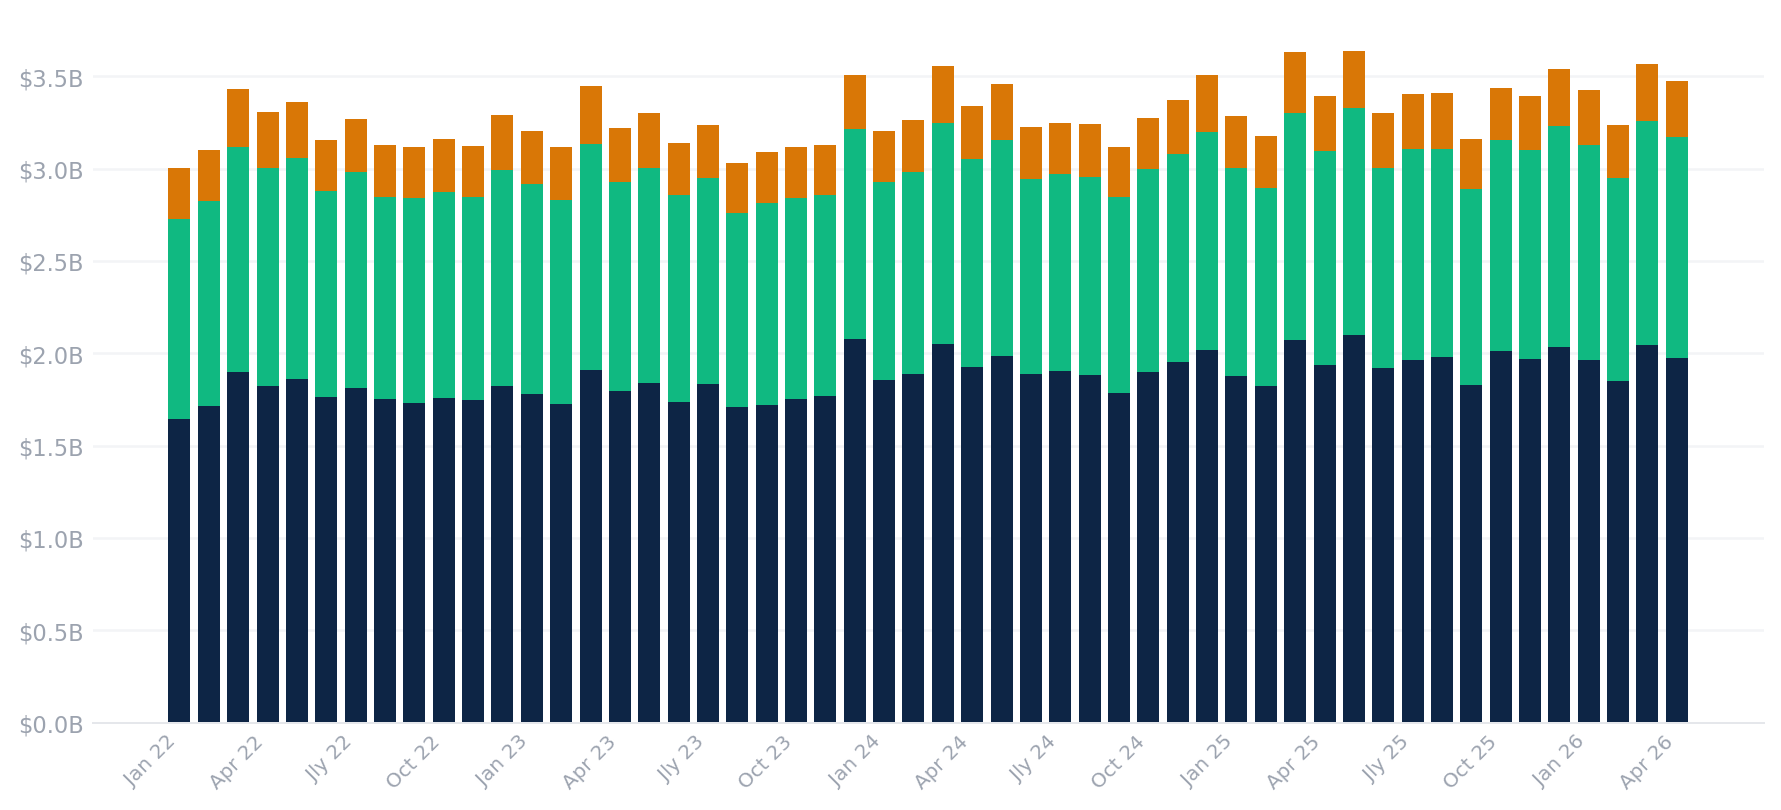
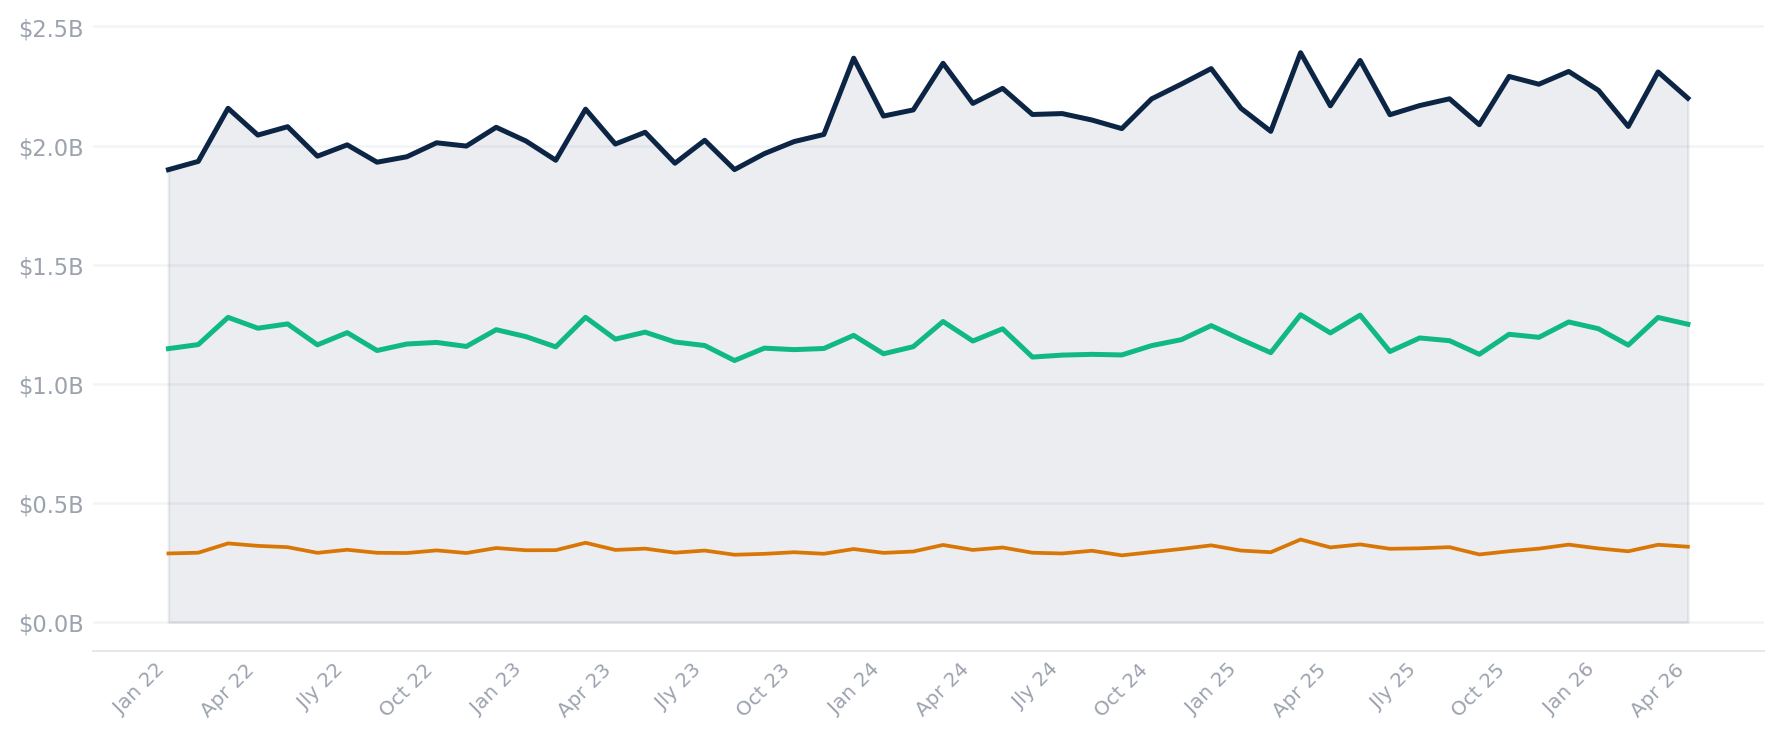
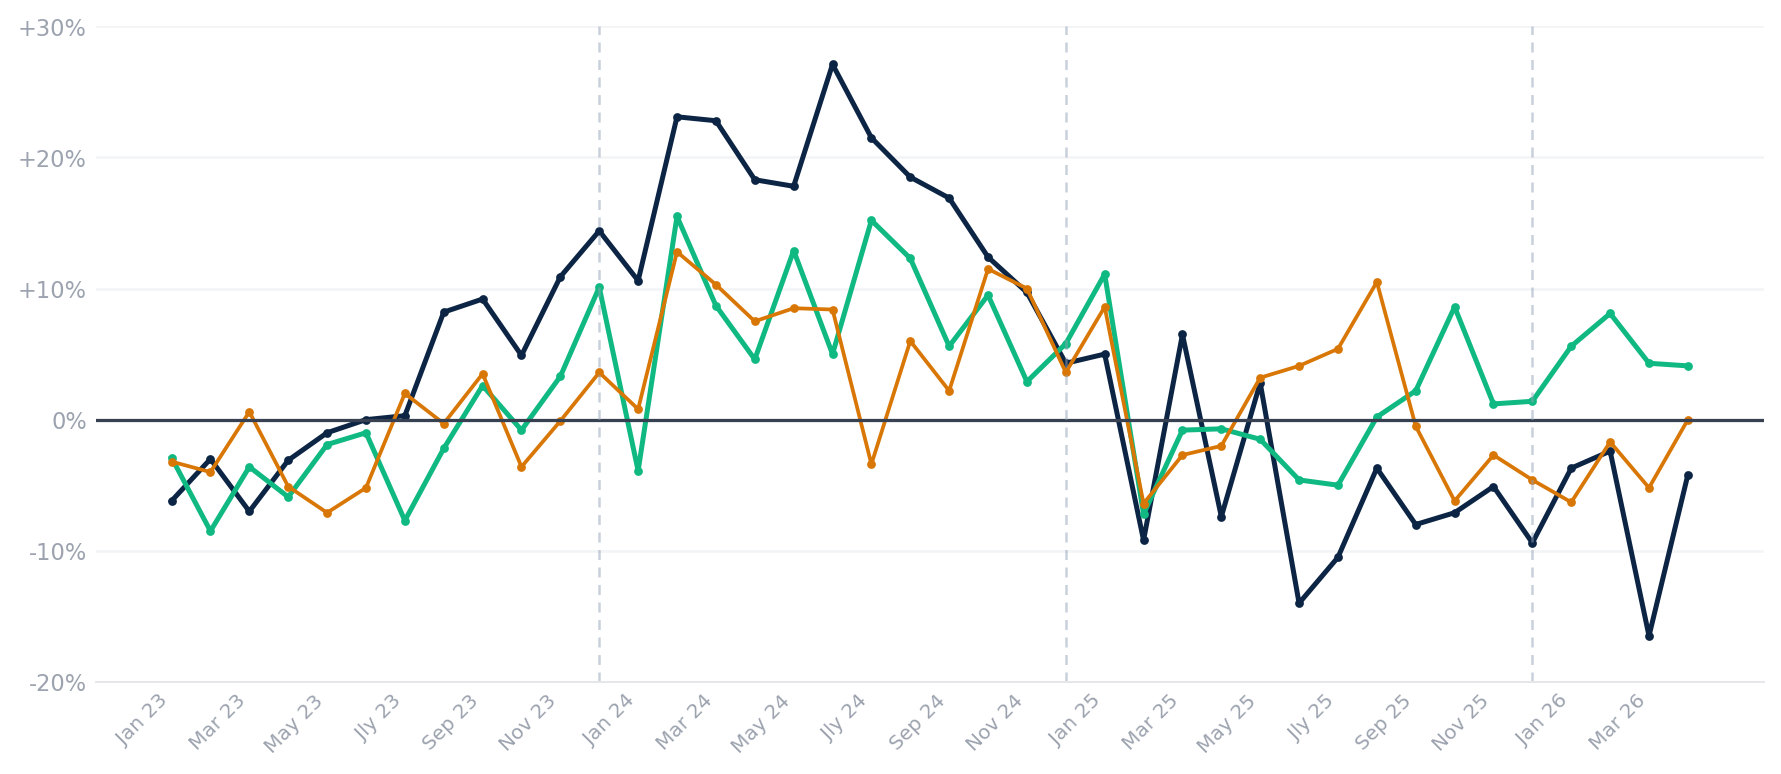
Year-Over-Year Volume Trends: Table Drop and Slot Handle by Sub-Area
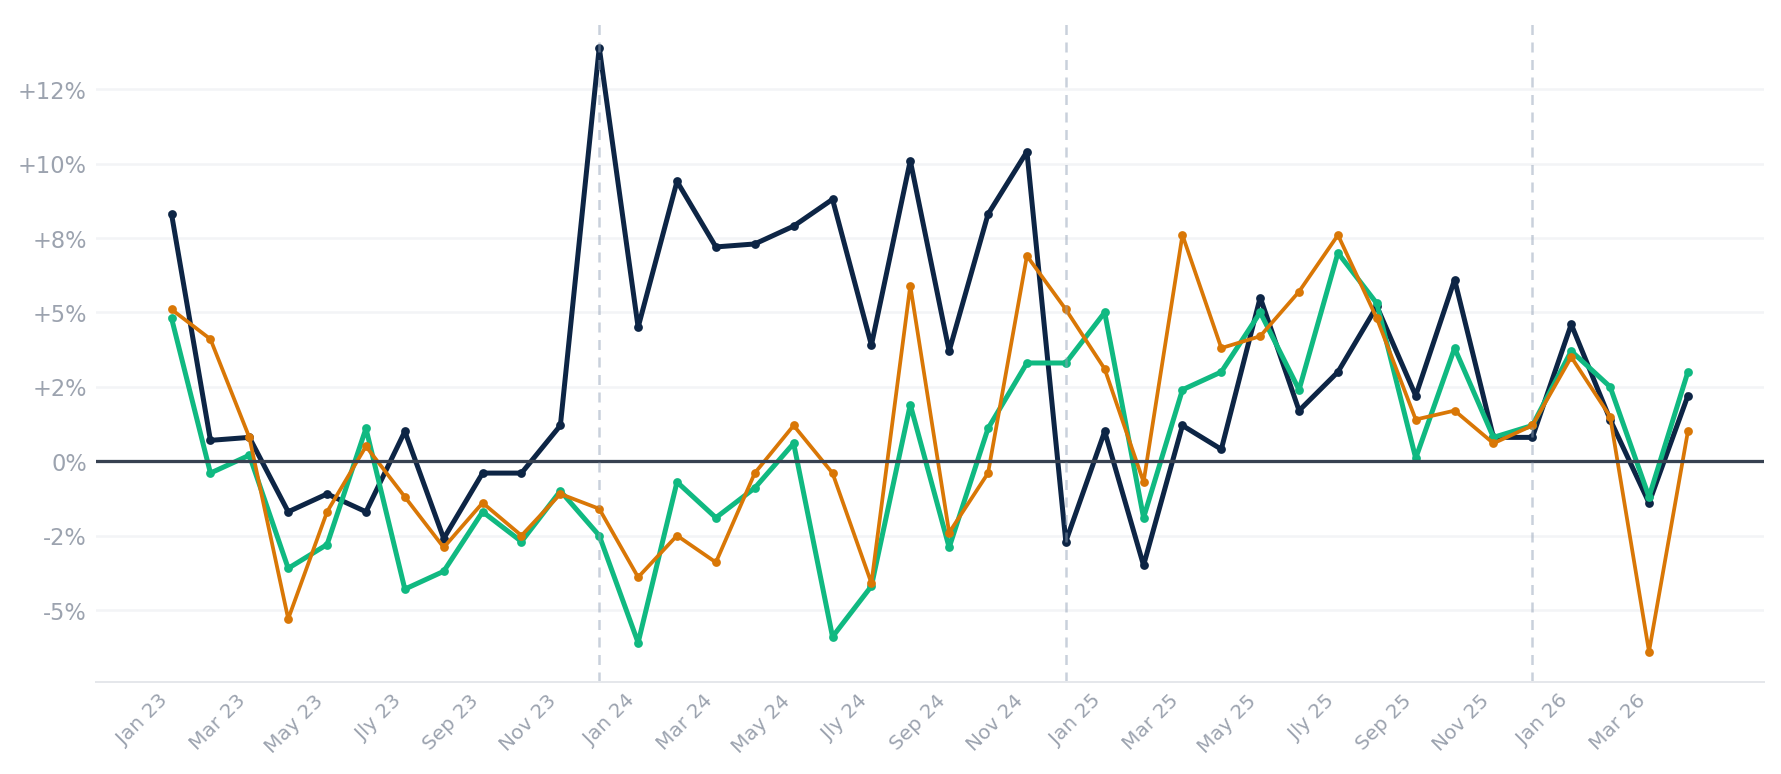
The month-by-month Y/Y percentage change in table drop and slot handle — calculated directly from the NGCB source data and independently verified against the underlying absolute figures — reveals a more granular story than the level-dollar charts alone. The two charts below plot Y/Y growth rates for all three sub-areas simultaneously. The zero line is the reference point: months above it show above-prior-year volume; months below show contraction. The vertical dashed lines mark calendar year boundaries to help read the annual narrative.
What the Volume Data Adds to the Win Story
Four things stand out when you move beyond win and look at the full throughput picture.
First, the Durango impact on Balance of County is more pronounced in volume than in win. Balance of County table drop averaged $224,880K per month in the 23 months before Durango opened and $259,905K per month in the 29 months since — a 15.6% increase, which exceeds the 12.9% growth in Balance of County gaming win over the same comparison. Slot handle grew a more modest 9.5% ($1.779M pre to $1.948M post) — slower than the win growth, not faster. The more reliable evidence for genuine volume expansion (rather than the same spending base simply losing more money per dollar played) is in the hold rates, not a simple volume-versus-win comparison: BalCo's table hold rate was essentially flat (13.20% pre-Durango to 13.11% post), and the slot hold rate rose only modestly (6.29% to 6.47%). Both are consistent with real increases in wagering activity rather than players getting unlucky at a higher rate. The year-over-year detail examined in the next section adds an important nuance: the table drop surge was concentrated in 2024 (averaging +16.9% Y/Y as Durango's first full year drove new table game volume), while 2025 saw BalCo table drop run negative Y/Y for most months (-5.0% annual average) as operators lapped those elevated 2024 comps. Slot handle, by contrast, maintained modest positive Y/Y growth through both years — suggesting slot volume growth is more gradual and durable, while the initial table game excitement around Durango was more of a step-change that normalized once the comparison base caught up.
Second, the table drop growth in Balance of County significantly outpaces its slot handle growth (+15.6% vs +9.5%). That divergence almost certainly reflects Durango's product mix: the property opened with 60+ table games and an upscale, resort-hotel positioning that draws a more table-oriented and higher-spend demographic than a pure slots-centric locals property would. Durango is pulling up the table component of the entire Balance of County mix, even though the NGCB data aggregates all operators in the sub-area.
Third, the hold rates tell a reassuring story. Balance of County table win percentage averaged 13.29% pre-Durango and 13.22% post — essentially flat, meaning the volume growth is not coming at the cost of giving back hold to attract play. Balance of County slot win percentage improved slightly from 6.29% to 6.47%, consistent with the addition of a modern machine floor (Durango opened with 2,300 of the newest slot titles) lifting the sub-area's average theoretical hold. The hold rates are not deteriorating — the operator is growing volume while maintaining rate.
Fourth, Boulder and North Las Vegas tell a different story. Boulder slot handle was essentially flat post-Durango (+0.2%, using the NGCB-triangulated April 2026 handle of 1,194,217K) while table drop grew 8.6% — both well below Balance of County's pace — and Boulder's table win percentage softened from 16.51% to 15.38%. That modest table-hold softening is worth monitoring, though it falls well within normal monthly variance for a sub-area of this size. Boulder slot hold is essentially unchanged at 6.38% pre vs. 6.41% post — Durango has not visibly impacted slot win rates in the Boulder corridor. North Las Vegas volume is essentially flat on both measures, consistent with its structurally independent demand base.
The Competitive Landscape: Who Operates in These Sub-Areas, and What Happened in Four Years
The NGCB sub-area aggregates are useful precisely because they capture everyone — but understanding what the data means requires knowing which operators sit inside each sub-area, what changed in the property landscape during the period, and whether the two publicly traded companies with the largest footprints in this market are telling a story consistent with what the numbers show. Both Red Rock Resorts and Boyd Gaming report disaggregated segment-level results for their Las Vegas locals operations, which provides a rare opportunity to triangulate public financial disclosures against primary-source regulatory data.
Property Mapping: Which Properties Sit in Which NGCB Sub-Area
The NGCB geographic classifications are based on physical location — properties within Henderson city limits and the Boulder Highway corridor report under Boulder Area, properties within the City of North Las Vegas report under North Las Vegas, and everything else in unincorporated Clark County (including Summerlin, the west side, the southwest corridor, and the northwest valley) falls under Balance of County. This produces some non-obvious groupings that matter for interpreting the sub-area data.
| Sub-Area | Property | Operator | Casino Sq Ft | Notes |
|---|---|---|---|---|
| Balance of County | Red Rock Casino Resort | RRR | ~100,000 | Flagship; Summerlin |
| Durango Casino & Resort | RRR | 83,000 | Opened Dec 5, 2023; SW Las Vegas | |
| Palace Station | RRR | ~84,000 | Central Las Vegas near I-15 | |
| Santa Fe Station | RRR | ~85,000 | Northwest Las Vegas | |
| The Orleans | Boyd | 135,460 | West Las Vegas | |
| Gold Coast | Boyd | 88,915 | West Las Vegas; hotel renovation Nov 2024 | |
| Suncoast | Boyd | 95,898 | Northwest Las Vegas; renovation underway | |
| Boulder Area (Henderson + Boulder Hwy) | Green Valley Ranch Station | RRR | ~75,000 | Henderson; major renovation in progress 2025-26 |
| Sunset Station | RRR | ~65,000 | Henderson; renovated sportsbook, new restaurants | |
| Boulder Station | RRR | ~65,000 | Boulder Highway | |
| Sam's Town | Boyd | 120,681 | Boulder Highway | |
| Cadence Crossing | Boyd | ~50,000 | Henderson; opened Q1 2026, replaced Jokers Wild | |
| North Las Vegas | Aliante Casino & Hotel | Boyd | ~70,000 | North Las Vegas; 202 hotel rooms |
| Wildfire North Lamb | RRR | ~10,000 | North Las Vegas tavern; opened Oct 2024 | |
| Wildfire Aliante | RRR | ~10,000 | NLV tavern across from Aliante Casino; opened Jan 2025 |
| Event | Property | Operator | Sub-Area | Date |
|---|---|---|---|---|
| Permanent closure | Wild Wild West Gambling Hall | RRR | Balance of County | Oct 2022 |
| Demolition completed | Texas Station (closed 2020) | RRR | North Las Vegas | 2022 |
| Demolition completed | Fiesta Rancho (closed 2020) | RRR | Balance of County | 2022–23 |
| Demolition completed | Fiesta Henderson (closed 2020) | RRR | Boulder Area | 2023 |
| New opening | Durango Casino & Resort | RRR | Balance of County | Dec 5, 2023 |
| Hotel renovation | Gold Coast | Boyd | Balance of County | Completed Nov 2024 |
| New tavern opening | Wildfire Seventy Six North Lamb | RRR | North Las Vegas | Oct 2024 |
| New tavern opening | Wildfire Seventy Six Aliante | RRR | North Las Vegas | Jan 2025 |
| Renovation underway | Suncoast Hotel and Casino | Boyd | Balance of County | 2024–ongoing |
| GVR renovation | Green Valley Ranch Station | RRR | Boulder Area | 2025–2026 (EBITDA drag) |
| Permanent closure | Eastside Cannery | Boyd | Boulder Area | Oct 2025 |
| New opening | Cadence Crossing Casino | Boyd | Boulder Area | Q1 2026 |
| Expansion (construction) | Durango Casino expansion | RRR | Balance of County | 2025–2026 |
| Hotel tower opening | M Resort Spa Casino (tower) | Penn Entertainment | Boulder Area | Dec 2025 |
| Entitlements pending | Inspirada Resort (planned) | RRR | Boulder Area | Future development |
Estimated Market Share: RRR vs. Boyd vs. All Others
Neither company reports gaming revenue broken out by NGCB sub-area. RRR's side of this comparison is precise: RRR discloses casino revenue as a distinct line in its consolidated statements of operations, so the figures below use RRR's actual reported casino revenue. Boyd's side still relies on an inferred ratio — Boyd does not disclose Las Vegas Locals segment gaming revenue directly, so it is estimated by applying the company-wide relationship between disclosed gaming revenue and total revenue to Boyd's Las Vegas Locals segment total revenue. What has improved is the quality of that ratio: Boyd's 10-Ks disclose company-wide total gaming revenue as a specific dollar figure each year ($2,705M in 2021 through $2,638M in 2025), separate from total revenue. Dividing one by the other reproduces the percentages Boyd itself states in the narrative text of each 10-K almost exactly (80% in 2021, 75% in 2022, 70% in 2023, 66% in 2024, 64% in 2025), confirming the underlying dollar figures are reliable. Because that company-wide ratio is diluted by Boyd's fast-growing Online segment — which has no presence in Las Vegas Locals — the estimate below instead divides total gaming revenue by total revenue with Online segment revenue excluded, producing a land-based-only gaming ratio (85% in 2021 down to 78% in 2025) that is then applied to Boyd's actual disclosed Las Vegas Locals segment revenue each year. The remaining approximation is twofold: the figure is still the product of a ratio applied to segment revenue, not a directly disclosed number, and that ratio is a company-wide blend across all of Boyd's land-based segments (Las Vegas Locals, Downtown Las Vegas, Midwest & South), not a Las Vegas Locals-specific figure — so it should be read as a close estimate grounded in real disclosed dollars, not an exact one.
| Year | NGCB 3-Area Win | RRR Casino Rev | RRR Est. Share | Boyd Est. Gaming Rev | Boyd Est. Share | All Others Est. |
|---|---|---|---|---|---|---|
| 2022 | $2,935M | $1,126.1M | ~38.4% | ~$753M | ~25.7% | ~36.0% |
| 2023 | $2,981M | $1,132.2M | ~38.0% | ~$731M | ~24.5% | ~37.5% |
| 2024 | $3,153M | $1,277.2M | ~40.5% | ~$695M | ~22.0% | ~37.5% |
| 2025 | $3,226M | $1,340.5M | ~41.6% | ~$694M | ~21.5% | ~36.9% |
Using Boyd's own disclosed gaming-revenue dollar figures, Boyd's estimated share of the three-area gaming market fell from roughly 25.7% in 2022 to roughly 21.5% in 2025, a decline of about 4.2 percentage points. "All Others" — the smaller and independent operators outside RRR and Boyd — gained an estimated 1 percentage point of share over the period (roughly 36.0% to 36.9%), essentially flat with a slight upward drift. Boyd's own conference call commentary attributes its Las Vegas softness specifically to Durango and RRR; the modest "All Others" gain here is not large enough to strongly support a claim that Boyd is losing meaningful share to smaller operators, though it is also not zero.
What Boyd Gaming's Conference Calls Confirm — and What They Add
Boyd's quarterly earnings calls provide the most direct operator-level corroboration — or challenge — to the analysis in this report. Over the 2022–2026 period, several specific statements from Boyd management are directly testable against the NGCB data.
Q1 2024 — Boyd explicitly attributes weakness to Durango: When Boyd's CEO Keith Smith reported Q1 2024 results (revenue in the Las Vegas Locals segment fell from $240M to $225M year-over-year, a $15M decline), he cited three factors: record 2023 comparisons, a soft locals market broadly, and — most notably — that Durango's December 2023 opening "has had an effect on competitors, both directly and indirectly." This is the most explicit third-party confirmation of Durango's competitive impact anywhere in the public record, and it comes from the CEO of the company most directly affected. It is entirely consistent with the NGCB data showing Balance of County growing 10.5% in 2024 while the specific properties within Boyd's Balance of County footprint declined.
2024 full year — share capture confirmed by the numbers: Over the full year 2024, Boyd's estimated Las Vegas Locals gaming revenue fell approximately 5.0% (from an estimated $731.3M to $694.7M) while the NGCB three-area combined gaming win grew 5.8% — both figures on a gaming-only basis. That roughly 10.8-percentage-point differential is the sharpest Boyd-vs.-market divergence in the four-year dataset, and it occurred entirely in the year when Durango was operating for its first full year. (Boyd's total Las Vegas Locals segment revenue, which also includes hotel, food and beverage, and other non-gaming revenue, fell a smaller 3.6% to $894.5M — the gaming-only decline was steeper than the headline segment-revenue decline suggests.) RRR's own casino revenue grew 12.8% in the same year. The market expanded, RRR captured the new demand and then some, and Boyd lost gaming share to RRR directly.
The specific Boyd properties hurt — and why the Orleans matters: Boyd's conference calls consistently named The Orleans and Gold Coast as the specific properties facing competitive pressure, while characterizing their other properties (Suncoast, Sam's Town, Aliante) as performing in line with the market. This is analytically important: The Orleans, located on Tropicana Avenue in the west valley, draws a higher proportion of destination and out-of-town guests than a typical locals property. Durango's opening — with 215 hotel rooms and a full resort experience — directly competes for that destination overlay of spending that The Orleans had partially captured. The Gold Coast, similarly located in the west valley corridor, faces direct geographic competition from Durango. Suncoast, located further northwest, appears to have been largely insulated.
2025 — some normalization, but less than the total-revenue figures suggest: By mid-2025, Boyd reported its "strongest quarterly Las Vegas Locals growth in more than two years" in Q2 2025 and continued gaming revenue growth in Q3 and Q4, though soft destination business and The Orleans competitive drag continued. This trajectory is broadly consistent with the NGCB data showing modest overall market growth in 2025 (Balance of County plus Boulder Area win grew 2.1%). RRR's own casino revenue, however, grew a stronger 5.0% in 2025 — driven by a 3.9% increase in slot handle against a 3.2% decline in table games drop, so the growth skewed toward RRR's higher-volume slot business rather than tables. On a gaming-only basis, RRR's 5.0% casino revenue growth notably outpaced the 2.1% market and was still well ahead of anything Boyd reported for the year. The initial Durango step-change had not fully normalized to market-level growth by 2025 the way RRR's total Las Vegas Operations revenue growth of 2.9% (a figure blended with softer hotel and food and beverage trends) might suggest — RRR's core gaming business was still growing meaningfully faster than its own market in Durango's second full year of operation, even as the gap between RRR and Boyd's total revenue figures narrowed on the surface.
Where Boyd and RRR Converge and Diverge with This Report's Conclusions
Five Convergences and Three Important Divergences
Convergence 1 — Durango impacted competitors, not just the aggregate. Boyd's explicit Q1 2024 statement that Durango affected competitors "directly and indirectly" is consistent with our finding that Balance of County aggregate gaming win accelerated in 2024 while Boyd's properties within the same sub-area declined. The aggregate expansion masked significant within-sub-area redistribution.
Convergence 2 — Core local customer strength throughout. Both companies consistently cited strength from local, in-market players as a growth driver from 2022 through 2025. This is consistent with the stable-to-growing volume metrics (table drop, slot handle) visible in the NGCB data for all three sub-areas — the locally driven demand base is not softening.
Convergence 3 — Market-level growth is genuine but modest; RRR's own gaming growth was not. Boyd's characterization of the locals market as experiencing "modest" growth when adjusting for Durango's specific competitive impact is consistent with the NGCB data: three-area gaming win grew 2.3% in 2025 (Balance of County plus Boulder Area, RRR's core footprint, grew 2.1%), a clear deceleration from 2024's surge. This part of the convergence holds. Where it weakens is on RRR's own side: RRR's casino revenue grew 5.0% in 2025 on a gaming-only basis — well ahead of the market, not comparably modest. RRR's total Las Vegas Operations revenue growth of 2.9% looks modest and in line with the market, but that figure blends softening hotel and food and beverage trends with still-elevated gaming growth; on a like-for-like gaming basis, RRR continued to outgrow its own market by a meaningful margin in 2025.
Convergence 4 — Boulder Area / Henderson underperforming Balance of County. Boyd's same-store properties in Boulder (Sam's Town) performed "in line with the broader market" while Balance of County properties (Orleans/Gold Coast) underperformed due to Durango. Our NGCB data shows Boulder Area growing much more slowly than Balance of County from 2022 to 2025. The two pieces of evidence are consistent.
Convergence 5 — Q1 2026 company-level softness vs. stable market, more pronounced for Boyd than "flat" suggests. The NGCB three-area market grew 2.8% in Q1 2026. Both companies underperformed it, but the degree differs by which figure is used. RRR's Las Vegas Operations total revenue grew 0.9%, while RRR's gaming-only casino revenue grew a closer 2.2% — a narrower shortfall than the total-revenue figure implies, and one management attributes to Green Valley Ranch renovation disruption rather than gaming softness. Boyd's Las Vegas Locals segment revenue — the correct like-for-like comparison to the NGCB locals data — fell 2.6% in Q1 2026, from $222.8M to $217.1M, a genuine decline rather than "roughly flat." Boyd's total consolidated revenue grew a modest 0.6%, but that figure is buoyed by growth in the Midwest & South segment and obscures the Las Vegas-specific softness. CFO Josh Hirsberg quantified the Las Vegas Locals shortfall at approximately $6.5 million on the earnings call, attributing roughly $5 million to destination-business softness concentrated at The Orleans and about $1.5 million to construction disruption from the ongoing Suncoast renovation. In both cases, the underlying market is healthier than either company's headline consolidated numbers suggest — but Boyd's Las Vegas-specific underperformance in Q1 2026 is more real, not less, once the comparison is made on a segment-consistent basis.
Divergence 1 — The Orleans "competitive pressure" narrative understates the structural story. Boyd frames the Orleans softness as competitive pressure from a specific event (Durango's opening). A closer read suggests something more structural: The Orleans was always partially a destination property in a locals company's portfolio, and Durango has permanently altered its competitive positioning in the west valley corridor. The NGCB data supports this — BalCo volume grew substantially while within-BalCo share shifted materially to RRR.
Divergence 2 — RRR's "market expansion" framing requires the Boyd data to stress-test it. RRR management repeatedly frames Durango as expanding the locals market. The NGCB aggregate data is directionally supportive of this. But the Boyd data reveals that a meaningful portion of Durango's apparent market contribution came from displacing Boyd's revenue within the Balance of County sub-area — not purely from attracting net-new gaming demand. Both effects are present. The market did expand; RRR also took share from Boyd. The honest answer is that Durango did both.
Divergence 3 — Boyd's own framing may understate how broad-based its share loss is, but the "All Others" evidence is not strong. The market-share estimate above shows Boyd's implied share of the three-area gaming market falling roughly 4.2 percentage points from 2022 to 2025, while RRR gained roughly 3.2 points — leaving only about 1 percentage point of estimated share migrating elsewhere ("All Others"), a gain modest enough to be within the estimate's own margin of error. Boyd's own commentary attributes its Las Vegas softness entirely to Durango and destination-visitor weakness at The Orleans, and this data is broadly consistent with that framing — the bulk of Boyd's estimated share loss over the period is consistent with having gone to RRR specifically, not to smaller independent operators. The honest reading is that the two-company comparison in this report captures most, though not quite all, of the competitive dynamic.
What the Investor Presentations Claim — and What the NGCB Data Says About Each Claim
Both RRR and Boyd present curated narratives to investors. Those narratives are designed to be compelling, and they generally are — but they also contain claims that are directly testable against the NGCB sub-area data assembled in this report. Testing them is useful not as an exercise in criticism but because it distinguishes which parts of the investment thesis rest on verifiable market data and which rest on assumptions or framing choices that the primary-source numbers do not fully support.
RRR's Three-Pillar Investment Framework
Red Rock's investor presentations since 2023 have consistently organized the investment case around three pillars: Nevada as the right place for growth, the locals gaming market as the right market, and RRR as the right company. The NGCB data intersects most directly with the second of those claims.
| RRR Investor Claim | Source | NGCB Data Assessment |
|---|---|---|
| "$3.2B locals GGR in 2024 — second largest gaming market in the US" | Q2 2025, Q4 2025, Q1 2026 decks | NGCB confirms: combined NLV + Boulder + BalCo 2024 win = $3.153B. Consistent. |
| "Durango continues to expand the Las Vegas locals market" | Q2 2025 earnings call (CFO Cootey); multiple presentations | Partially supported. BalCo aggregate grew, but Boyd's BalCo properties declined concurrently. Both expansion and share capture occurred. |
| "76% of local carded slot revenue from guests visiting 4+ times/month" | Q4 2025, Q1 2026 presentations (up from 75% in the Q2 2025 deck) | Cannot be verified from NGCB data (no loyalty segmentation). Directionally consistent with stable slot volume metrics in the dataset — no evidence of demand erosion. The Q1 2026 deck adds that guests visiting 8+ times per month account for 50% of slot revenue, underscoring how concentrated the revenue base is among the most frequent visitors. |
| "Nevada population grew 40% between 2004 and 2024; third-fastest growing state" | Q3 2025 investor presentation | U.S. Census Bureau sourced (per the presentation). Addressed separately in upcoming article on Clark County population growth and the locals market. |
| "Durango attracted 108,000 new loyalty database customers since opening" | Q2 2025 earnings call (President Scott Kreeger) | Strongest evidence for genuine market expansion. If these are net-new customers not previously in RRR's database, it suggests real demand creation beyond share redistribution. Cannot be independently verified from NGCB data. |
| Locals GGR to reach $4.3B–$6.3B by 2036 (3%–7% annual growth) | Q1 2026 investor presentation | Forward projections. 2022–2025 NGCB CAGR = 3.2% (consistent with low-end scenario). The 5–7% scenarios embed meaningful acceleration that exceeds the four-year observed rate. |
| "SB 208 significantly limits casino development outside the Strip" | All presentations; 10-K (2024, 2025) | Regulatory fact. Durango itself required a pre-existing gaming enterprise district entitlement. RRR's 461-acre land bank is genuinely valuable under this constraint. |
| Ninth consecutive record quarter (Q4 2025) for net revenue and Adjusted EBITDA; extended to a tenth consecutive record quarter for net revenue in Q1 2026 | Q4 2025 presentation; Q1 2026 presentation and earnings release | Consistent with NGCB BalCo win growing every calendar year 2022–2025. The market grew and RRR outgrew the market. The net revenue streak is real and has continued — but it is worth noting the Adjusted EBITDA half of the streak broke in Q1 2026: Las Vegas Operations Adjusted EBITDA declined 1.5% year-over-year that quarter, consistent with the Green Valley Ranch renovation disruption discussed elsewhere in this report. The "record quarter" framing in RRR's own materials narrows to net revenue only starting Q1 2026. |
The claim that deserves the most scrutiny — and the most nuanced treatment — is Durango's market expansion narrative. The 108,000 new loyalty database customers is the single most important data point in RRR's investor materials for substantiating genuine demand creation. If those customers were not previously gaming at other local properties, Durango expanded the addressable market in a meaningful way. But "new to the RRR database" is not the same thing as "new to the locals gaming market" — some of those customers may have migrated from non-Station properties, including Boyd's. The NGCB data can tell us that the sub-area aggregate grew; it cannot tell us whether Durango created new gaming demand or captured demand that previously flowed elsewhere.
Boyd Gaming's Investor Framing: Core vs. Destination
Boyd's investor narrative on the locals market has evolved over the period. The most analytically precise framing came in response to an analyst question on the Q4 2025 earnings call, asking management to distinguish core resident play from destination or out-of-town play. CEO Keith Smith fielded the question directly, describing continued strength from local residents alongside softness specifically among out-of-town visitors, quantifying that softness as a $6 million Q4 hotel revenue decline concentrated at The Orleans, up slightly from $5 million in Q3. CFO Josh Hirsberg added a brief follow-up affirming the point. The bottom-line message from Smith was explicit: the core locals business remains healthy while the destination-visitor segment, concentrated at The Orleans, is the source of weakness.
This bifurcation is analytically important for reading the NGCB data. The NGCB sub-area gaming win figures combine true locals play and destination/regional play at all operators. Boyd's characterization of core locals demand as strong is consistent with the NGCB showing positive gaming volume trends in table drop and slot handle across all three sub-areas throughout the period. Boyd's characterization of destination play as weak shows up specifically at The Orleans — a Balance of County property that, as noted in this report, draws a higher proportion of out-of-town guests than a typical locals property. The two halves of Boyd's market — pure locals and destination overlay — are generating meaningfully different results, and the NGCB aggregate obscures that distinction entirely.
What Wall Street Is Saying About This Market
Several sell-side and credit analysts have published directly relevant work on the Las Vegas locals market over the past 18 months. Their conclusions provide useful external validation — and in some cases useful correction — of the analytical framework in this report. The four analysts referenced below are cited briefly, for the narrow purpose of testing this report's findings against independent third-party views; they are not the basis of the research itself, which is built from the author's own reconstruction of NGCB primary data and direct review of RRR's and Boyd's SEC filings, earnings releases, and investor presentations.
Four Analysts on the Las Vegas Locals Market: Convergences and Divergences
Carlo Santarelli, Deutsche Bank (January 2025) — The most rigorous challenge to the consensus: Santarelli published the most analytically disciplined work on the 2024 locals market, and his conclusions are highly consistent with this report. He estimated that through October 2024, the same-store locals market (excluding Durango) was down approximately 3% year-over-year, and separately noted that North Las Vegas gaming revenue was down 2.7% and the Boulder Strip was down 1.1% year-to-date — two sub-areas unlikely to be affected by Durango — supporting his view that the same-store weakness was broad-based, not just concentrated where Durango competed. He estimated Durango's 2024 gross gaming revenue at approximately $260 million and property-level EBITDA at approximately $160 million, generating a property-level margin well above the broader RRR portfolio average. He described the 2024 locals environment as one where "market-wide EBITDAR is likely to be down high single digits year-over-year" when excluding Durango's contribution, and cautioned that consensus estimates for both RRR and Boyd for 2025 might prove too optimistic absent genuine same-store revenue growth. This is the most important independent corroboration of the analytical conclusions in this report.
David Katz, Jefferies (December 2025) — Bullish on locals vs. Strip divergence: Katz explicitly stated that the Las Vegas Strip "remains peakish" and that he prefers locals casinos. He cited favorable economic trends in the Las Vegas region and characterized RRR's capital project pipeline as well-defined, with regional economic tailwinds he views favorably. He was notably positive on both RRR and Boyd capital investment programs as market catalysts into 2026–27. Katz's framework is consistent with the volume data in this report showing that the locals market has been building throughput (table drop and slot handle) even in years when win was modest.
John DeCree, CBRE (January 2026) — Historical resilience and fiscal tailwinds: DeCree made the structural case that the locals market has historically been more resilient than the Strip during downturns — specifically that since 1984, Strip GGR has declined eleven times versus only six for the locals market. He identified the OBBBA tax cuts (no taxes on tips, overtime exclusion, senior deduction) as a near-term tailwind for the locals core customer base, noting that the concentration of tipped workers and retirees in Las Vegas disproportionately benefits the locals market relative to the Strip. He cited 38.5 million Strip visitors in 2025 — down 7.5% year-over-year and the twelfth consecutive month of annual declines — as evidence of the divergence already in progress. His positive view of the locals market for 2026 is broadly consistent with the NGCB showing continued growth despite the softer broader tourism environment.
Kim Noland, Gimme Credit (January 2026) — Confirming share dynamics: Noland offered the clearest external statement of the RRR-vs.-Boyd share dynamic yet published, attributing RRR's outperformance to a combination of two factors: genuine market expansion driven by Durango since its opening, and RRR actively taking share from competitors through its major property expansions. She also directly attributed Boyd's underperformance to Durango's success — a more direct causal claim than Boyd's own "competitive pressures" framing. Her assessment is entirely consistent with the market share estimates derived in this report and with the NGCB data.
The OBBBA: Tailwind with an Important Caveat
All four analysts cited above referenced the One Big Beautiful Bill Act (OBBBA), signed into law on July 4, 2025, as a potential tailwind for the Las Vegas locals market. The tax law's provisions eliminating federal taxes on tip income and creating a new senior citizen deduction are genuinely favorable for the locals operators' core customer base — Las Vegas has an unusually high concentration of tipped hospitality workers and cost-conscious retirees, both of whom would see disposable income increase under these provisions.
However, the OBBBA also included a provision that received less attention in gaming investor presentations: a 90% cap on gambling loss deductions, effective starting in 2026. Under previous law, gambling losses could be deducted in full against gambling winnings. Under the new provision, only 90% of losses can be deducted, effectively creating a scenario where a gambler who breaks even on the year could still owe federal income tax. The Joint Committee on Taxation estimated this provision would raise approximately $1.1 billion over ten years, suggesting it affects enough gaming volume to be financially meaningful. Nevada lawmakers from both parties — including Representatives Dina Titus (who introduced the FAIR BET Act on July 7, 2025) and Senators Catherine Cortez Masto — moved quickly to repeal the provision, citing concerns that it would drive gambling volume to offshore and black-market platforms. As of July 2026, the repeal effort remains active. The net effect of the OBBBA on the locals gaming market is therefore uncertain: the tip and senior provisions are positive, and the gambling deduction cap is negative, and the two may substantially offset each other depending on the makeup of each operator's customer base. The article notes this caveat and does not take a position on the net direction.
The Strip Divergence as Context for Locals Outperformance
The Las Vegas Strip — which relies heavily on domestic and international air travel, convention demand, and discretionary vacation budgets — reported 38.5 million visitors in 2025, down 7.5% year-over-year and the twelfth consecutive month of annual declines through December. This sustained tourism softness has not been visible in the NGCB locals sub-area data over the same period: combined NLV, Boulder, and Balance of County gaming win grew 2.3% in 2025. The divergence between a declining Strip and a growing locals market is precisely what locals operators have always argued distinguishes their business model. The NGCB data confirms that divergence was real and measurable in 2025.
The Strip's headline 2025 result actually understates how weak the underlying trend was. Per the NGCB's own year-end summary (the December 2025 Monthly Revenue Report, twelve-month column), Strip gaming win for calendar 2025 was essentially flat at $8,815.2 million, up just 0.03% from 2024. But baccarat win — a notoriously volatile, whale-driven, high-hold-variance category that has little to do with underlying visitor demand — rose 3.4% for the year to $1,409.6 million. Strip gaming win excluding baccarat was actually down approximately 0.6% for the full year. In other words, the Strip's flat headline number in 2025 was itself propped up by favorable baccarat hold; on a like-for-like, demand-driven basis, the Strip was outright negative while the locals market grew 2.1–2.3%, depending on which sub-area combination is used. The divergence this section describes is not a headline artifact — it holds, and arguably widens, once the Strip's most volatile and least demand-sensitive revenue category is stripped out.
At the same time, the Boyd Q4 2025 and Q1 2026 data shows that the distinction between "true local" and "destination-with-a-locals-tilt" is not always clean within the locals segment itself. The Orleans explicitly experienced softer results from regional visitors in ways that more purely local properties (Aliante, Suncoast, Sam's Town) did not. So the correct framing is probably a spectrum rather than a binary: at one end, properties like Aliante and Boulder Station whose revenue is almost entirely locally captive; at the other end, properties like The Orleans and Green Valley Ranch that draw meaningfully from regional and out-of-town visitors and are therefore more exposed to tourism cycles than the sub-area aggregate implies.
Company vs. Market: Does RRR's Reported Growth Track the NGCB Data?
The preceding section established who operates in these sub-areas and what Boyd Gaming's results tell us about the competitive dynamics. This section examines how RRR's own reported financials track against the NGCB market data over the same period — and where the two series converge or diverge.
Station Casinos' properties — Red Rock Casino Resort, Green Valley Ranch, Durango, Palace Station, Boulder Station, Sunset Station, and Santa Fe Station — sit almost entirely within the Balance of County and Boulder Area sub-areas, with essentially no footprint in North Las Vegas. So the cleanest market benchmark for RRR specifically is combined Balance of County plus Boulder Area gaming win, not the full three-area total. The comparison below uses RRR's reported casino revenue rather than total Las Vegas Operations segment revenue, since casino revenue is gaming-only and maps directly to the NGCB's gaming win figures — an apples-to-apples comparison that isolates gaming performance from the hotel, food and beverage, and other non-gaming revenue that also sits inside the segment total.
| Year | RRR Casino Revenue | RRR YoY | Balco + Boulder Win | Market YoY | Gap (pp) |
|---|---|---|---|---|---|
| 2022 | $1,126.1M | — | $2.65B | — | — |
| 2023 | $1,132.2M | +0.5% | $2.69B | +1.7% | -1.2 |
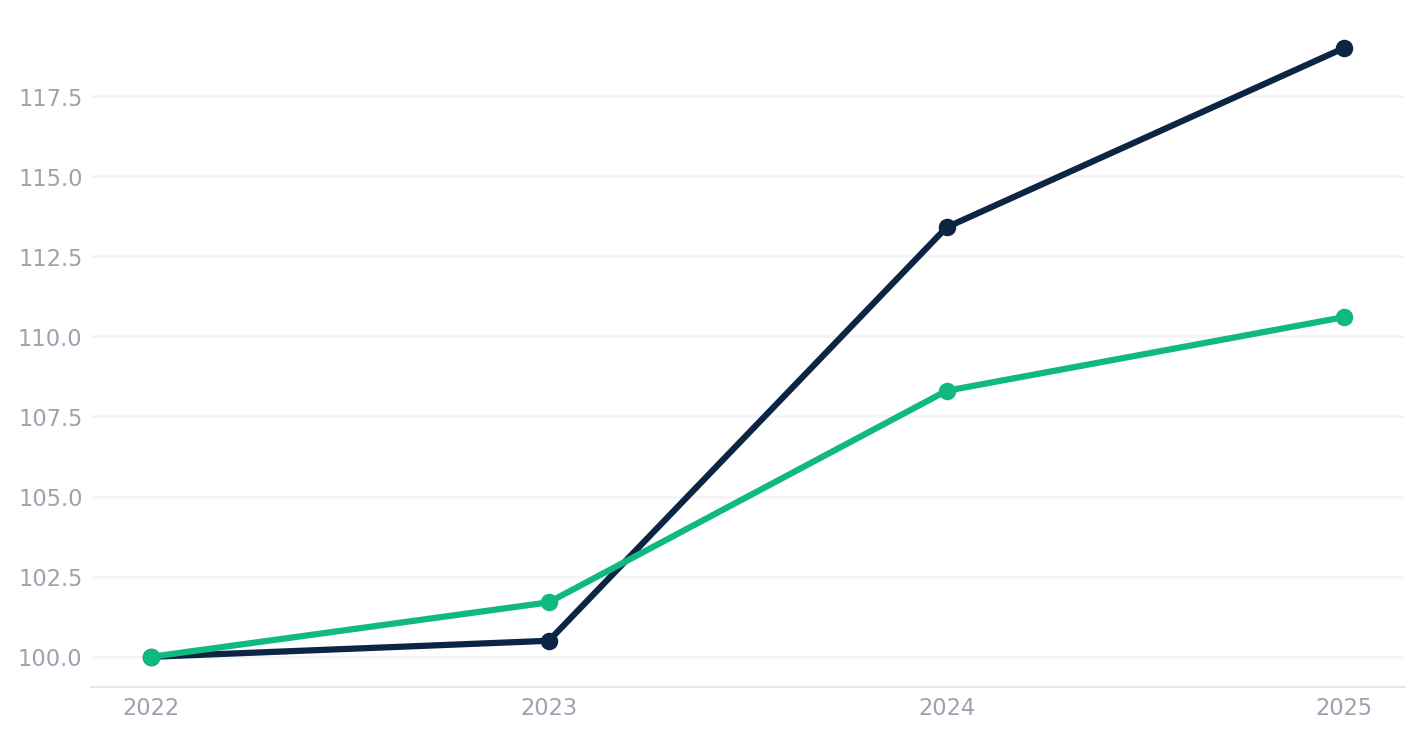
| 2024 | $1,277.2M | +12.8% | $2.87B | +6.6% | +6.2 |
| 2025 | $1,340.5M | +5.0% | $2.93B | +2.1% | +2.9 |
| Q1 2026 | — | +2.2% | — | +2.8% | -0.6 |
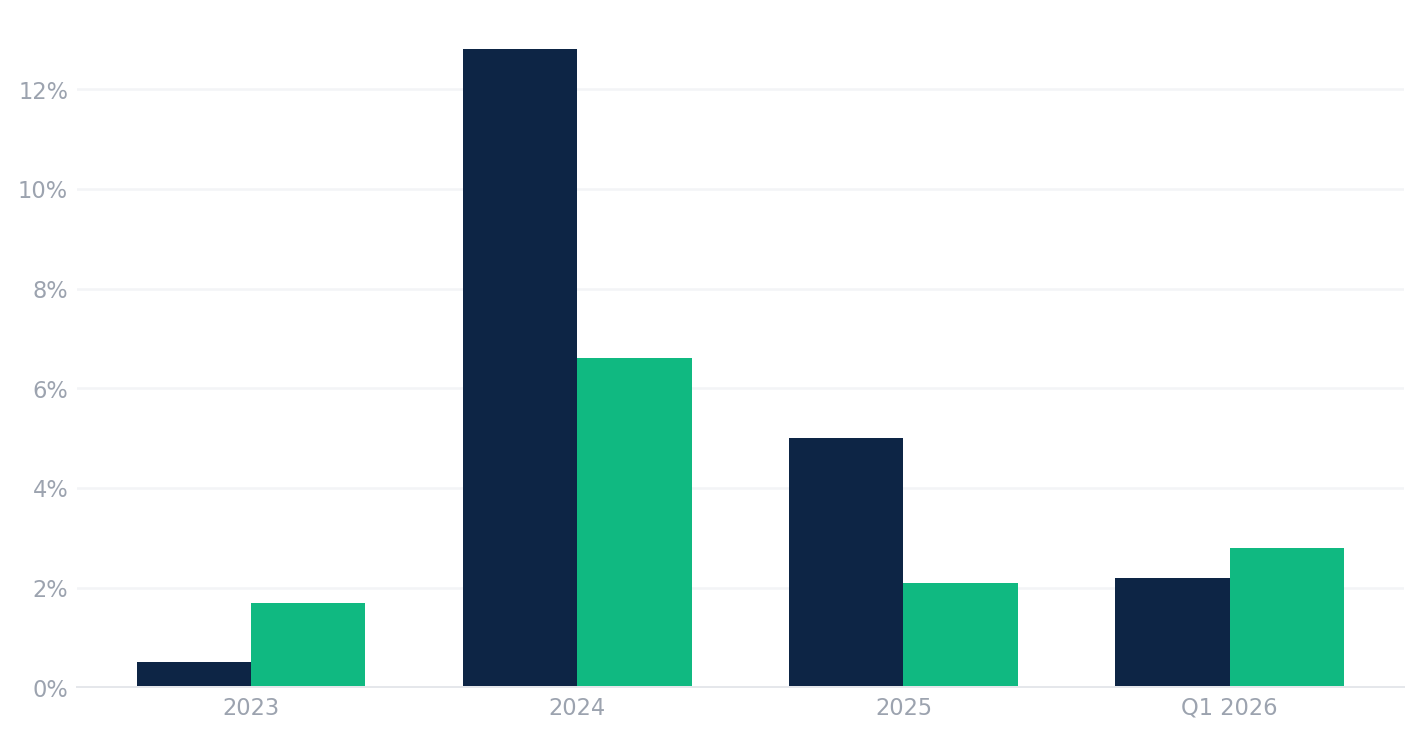
RRR's casino revenue grew 19.0% cumulatively from 2022 to 2025 against the market's 10.6% — an 8.4-percentage-point cumulative gap. But that headline figure masks a year-by-year pattern that only shows up once non-gaming revenue is stripped out of RRR's side of the comparison. 2023 was not convergence — RRR's casino revenue actually trailed the market that year (+0.5% versus the market's +1.7%, a -1.2 percentage-point gap). RRR's total Las Vegas Operations revenue grew a faster 3.6% that year, but that strength was concentrated in hotel and food and beverage, not gaming; on a gaming-only basis, 2023 was a year in which RRR's core casino business grew slower than its own core sub-area market, before Durango opened. 2024 — Durango's first full year — is where the two series diverge sharply: RRR's casino revenue jumped 12.8% while gaming win across its core sub-areas rose 6.6%, a 6.2-percentage-point gap. The market itself also accelerated meaningfully that year, more than doubling its 2023 growth rate, which supports the idea that 2024 had a genuine expansionary component to it and was not purely a zero-sum reshuffling of existing demand — but RRR still grew nearly twice as fast as that expanding market, meaning it captured real share on top of the broader lift. By 2025, the gap remained wide rather than closing: casino revenue growth was +5.0% against the market's +2.1%, a 2.9-percentage-point gap — RRR's core gaming business kept outgrowing its own market through 2025, even as RRR's total segment revenue growth slowed to +2.9% (a figure dragged down by declining room revenue, unrelated to gaming demand).
A note on consistency with the market-share table earlier in this article: that table has also been corrected to use RRR's actual reported casino revenue rather than a proxy ratio, so both the Company vs. Market comparison here and the market-share estimate earlier now share the same RRR revenue basis. The remaining estimation risk in this article sits entirely on Boyd's side of the market-share table, since Boyd does not disclose Las Vegas Locals segment gaming revenue and that figure must still be approximated — see the methodology note accompanying that table.
A Modest Reversal, Concentrated in Non-Gaming: RRR Narrowly Trailing the Market
Using the January–March 2026 monthly data in this report (true calendar Q1), combined Balance of County plus Boulder Area win grew approximately 2.8% year-over-year in Q1 2026. On a gaming-only basis, RRR's casino revenue grew 2.2% over the same period — a -0.6 percentage-point gap, and the first quarter in this dataset where RRR's core gaming business trailed the market, but only narrowly. The headline shortfall looks larger at the total-revenue level: RRR's Las Vegas Operations net revenue grew only 0.9%, and Adjusted EBITDA from Las Vegas operations actually declined 1.5% in the quarter. The gap between the -0.6pp gaming shortfall and the wider total-revenue shortfall points to where the real disruption sits — outside the casino floor.
Management's own explanation is consistent with that read. On the Q1 2026 earnings call, the company attributed the margin compression primarily to the loss of room nights and convention space during the Green Valley Ranch renovation — approximately 27,000 room nights offline in the quarter, about 10% of total inventory — plus ongoing construction disruption at Durango. The 10-Q's own casino detail supports this too: slot handle rose 1.2% and slot hold was flat, while table games drop fell 3.6%, a mixed but not alarming picture for a business generating 80% of casino revenue from slots. Guidance for Q2 2026 explicitly embeds $11–12 million of construction-related EBITDA disruption on top of typical seasonal softness.
That distinction matters for how you read this. The market itself isn't decelerating — 2.8% Q1 2026 growth is actually a touch ahead of the market's full-year 2025 pace — so the modest gaming-revenue shortfall (-0.6pp) looks like ordinary quarter-to-quarter noise around a business that outgrew its market in both 2024 and 2025, not the start of a share-loss trend. The larger total-revenue shortfall is better explained by the disclosed, dated construction disruption at Green Valley Ranch and Durango than by any change in underlying gaming demand. It's still worth flagging as a watch item: if the gaming-revenue gap widens in subsequent quarters, or the total-revenue shortfall persists after the Green Valley Ranch rooms return and the Durango expansion completes, that would be a more meaningful signal about share or pricing power than the current data supports. One quarter of narrow gaming underperformance against a backdrop of explicitly disclosed construction disruption is not a structural deceleration.
It's also worth pressure-testing management's recurring claim that "Durango continues to expand the locals market" against this data. The 2024 evidence is the strongest support for that framing in the dataset — both RRR's revenue and the broader Balance of County market accelerated together that year, which is more consistent with genuine demand creation than pure cannibalization. But "expands the market" is doing some rhetorical work here too: it's equally consistent with Durango capturing share from competitors within an already-strong Balance of County submarket, at a time when locals demand county-wide was independently robust for reasons unrelated to any single property — post-pandemic normalization, population growth in the southwest valley, and so on. The NGCB sub-area aggregates can't fully disentangle true demand creation from share capture; that would require RRR's own same-store versus total-portfolio disclosure, which the company doesn't break out at the sub-area level. The honest conclusion is that the data is directionally supportive of management's framing without being dispositive of it.
Why Primary-Source Data Still Matters
One of the things I have always believed — as an institutional analyst and as a CFO — is that the value of primary-source data lies not in having it, but in knowing what questions to ask of it. The NGCB monthly reports are public. Anyone can pull them. The analytical edge comes from understanding how the sub-area geography maps to operator footprints, how slot hold percentages and table drop interact with revenue, and how to distinguish structural trends from seasonal noise.
I built and maintained detailed financial models on gaming operators for most of my professional career because that discipline — the model-level granularity — is what separates informed judgment from informed-sounding judgment. The January 2022 start date for this dataset was not arbitrary: a post-opening-only window cannot test whether a new property expanded its market or cannibalized it, because you have no baseline to compare against. The 52-month window gives that baseline. The data updates my RRR valuation model monthly, and it informs the views I hold on the company as a private investor. The picture it paints for the Balance of County market is of a stable, locally-driven gaming market that has genuinely grown since Durango opened — modestly, but genuinely — where the most important strategic question for RRR shifts from whether Durango can grow the total market to how much of that growth is durable versus a one-time step-up, and whether the property can sustain its share at margins that justify its capital cost.
That is a question the NGCB data alone cannot answer, but it is the right question to be asking. And four years of monthly data — with a real pre- and post-opening baseline on both sides — gives us considerably more confidence in what we are dealing with than two years did.